Financial Position (For Year Ended March 31)
Statement of Income and Expenses
I. Operating activities
(Unit: ¥1,000)
| FY 2020 | FY 2021 | FY 2022 | FY 2023 | FY 2024 | FY 2025 | |
|---|---|---|---|---|---|---|
| 1. Income | ||||||
| From endowment | 1,802,582 | 1,725,827 | 3,760,858 | 11,689,939 | 1,951,589 | 3,217,046 |
| From special funds | 1,709,678 | 1,793,095 | 4,175,585 | 11,565,310 | 2,521,102 | 3,764,407 |
| Other income | 131,346 | 231,584 | 230,472 | 1,203,244 | 309,553 | 595,651 |
| Contributions/grants | 602,944 | 1,353,809 | 1,775,170 | 6,172,739 | 2,058,002 | 4,235,280 |
|
Total income from operating activities |
4,246,550 |
5,104,315 |
9,942,084 |
30,631,233 |
6,840,246 |
11,812,384 |
| 2. Expenses | ||||||
| Programs | 2,342,480 | 2,729,060 | 4,128,823 | 5,055,678 | 6,671,751 | 7,627,100 |
| General and administrative | 314,783 | 324,076 | 425,139 | 455,770 | 504,816 | 510,189 |
|
Total expenses from operating activities |
2,657,263 |
3,053,136 |
4,553,962 |
5,511,448 |
7,176,567 |
8,137,289 |
|
Net income from operating activities |
1,589,287 |
2,051,179 |
5,388,122 |
25,119,785 |
△ 336,320 |
3,675,095 |
II. Investing activities
(Unit: ¥1,000)
| FY 2020 | FY 2021 | FY 2022 | FY 2023 | FY 2024 | FY 2025 | |
|---|---|---|---|---|---|---|
| 1. Income | ||||||
|
Proceeds from sales of investments |
177,197 |
306,409 |
659,584 |
1,407,772 |
2,653,659 |
2,962,409 |
| Deposits return income | 0 | 0 | 0 | 0 | 0 | 0 |
| Sale of property | 0 | 0 | 0 | 0 | 2,445 | 0 |
| Total income from investing activities |
177,197 |
306,409 |
659,584 |
1,407,772 |
2,656,104 |
2,962,409 |
| 2. Expenses | ||||||
| Purchase of endowment | 0 | 0 | 0 | 0 | 0 | 4,500 |
| Purchase of investments | 1,039,269 | 1,963,819 | 5,516,178 | 24,238,107 | 1,600,194 | 5,283,847 |
| Purchase of property | 53,892 | 25,366 | 46,142 | 32,697 | 530,102 | 284,274 |
| Long-term prepaid expenses | 0 | 0 | 0 | 0 | 0 | 0 |
| Total expenses from investing activities |
1,093,161 |
1,989,185 |
5,562,320 |
24,270,804 |
2,130,296 |
5,572,621 |
| Net income from investing activities |
△ 915,964 |
△ 1,682,776 |
△ 4,902,736 |
△ 22,863,032 |
525,807 |
△ 2,610,212 |
III. Financing activities
(Unit: ¥1,000)
| FY 2020 | FY 2021 | FY 2022 | FY 2023 | FY 2024 | FY 2025 | |
|---|---|---|---|---|---|---|
| 1. Income | ||||||
|
Total income from financing activities |
0 |
0 |
0 |
0 |
0 |
0 |
| 2. Expenses | ||||||
|
Total expenses from financing activities |
0 |
0 |
0 |
0 |
0 |
0 |
|
Net income from financing activities |
0 |
0 |
0 |
0 |
0 |
0 |
| Net income | 673,323 | 368,403 | 485,386 | 2,256,753 | 189,487 | 1,064,883 |
| Net income, beginning of year | 3,054,262 | 3,727,585 | 4,095,988 | 4,581,374 | 6,838,127 | 7,027,614 |
| Net income, end of year | 3,727,585 | 4,095,988 | 4,581,374 | 6,838,127 | 7,027,614 | 8,092,497 |
*Net income from merger
Statement of Changes in Net Assets
I. Net assets ― unrestricted
(Unit: ¥1,000)
| FY 2020 | FY 2021 | FY 2022 | FY 2023 | FY 2024 | FY 2025 | |
|---|---|---|---|---|---|---|
|
1. Recurring revenues and expenses |
|
|
|
|
|
|
| (1) Recurring revenues | 4,014,039 | 4,423,802 | 5,243,970 | 7,299,393 | 7,375,173 | 10,958,135 |
| (2) Recurring expenses | 2,874,557 | 3,277,034 | 4,745,518 | 5,673,618 | 7,347,041 | 8,399,699 |
|
Net assets from recurring activities before valuation |
1,139,482 |
1,146,768 |
498,452 |
1,625,775 |
28,132 |
2,558,437 |
|
Profit and loss on appraisal in basic assets |
2,336,615 |
1,954,503 |
3,539,069 |
22,209,536 |
101,430 |
9,434,896 |
|
Net assets from recurring activities |
3,476,097 |
3,101,271 |
4,037,522 |
23,835,310 |
129,562 |
11,993,333 |
|
2. Non-recurring revenues and expenses |
|
|
|
|
|
|
| (1) Non-recurring revenues | 1,031 | 0 | 814 | 0 | 2,445 | 489 |
| (2) Non-recurring expenses | 0 | 0 | 0 | 11 | 17,843 | 0 |
| Net assets from non-recurring activities |
1,031 |
0 |
814 |
△ 11 | △ 15,398 | 489 |
| Change in unrestricted | 3,477,128 | 3,101,271 | 4,038,335 | 23,835,300 | 114,164 | 11,993,821 |
|
Net assets-unrestricted, beginning of year |
32,210,044 |
35,687,172 |
38,788,443 |
42,826,778 |
66,662,078 |
66,776,242 |
|
Net assets-unrestricted, end of year |
35,687,172 |
38,788,443 |
42,826,778 |
66,662,078 |
66,776,242 |
78,770,064 |
II. Net assets ― temporarily restricted
(Unit: ¥1,000)
| FY 2020 | FY 2021 | FY 2022 | FY 2023 | FY 2024 | FY 2025 | |
|---|---|---|---|---|---|---|
|
Change in net asset ― temporarily restricted |
11,516,710 | 9,840,084 | △ 722,929 | 10,383,722 | 1,495,130 | 29,738,102 |
|
Net assets ― temporarily restricted, beginning of year |
102,288,206 | 113,804,916 | 123,645,000 | 122,922,071 | 133,305,793 | 134,800,923 |
|
Net assets ― temporarily restricted, end of year |
113,804,916 | 123,645,000 | 122,922,071 | 133,305,793 | 134,800,923 | 164,539,025 |
III. Total net assets, end of year
(Unit: ¥1,000)
| FY 2020 | FY 2021 | FY 2022 | FY 2023 | FY 2024 | FY 2025 | |
|---|---|---|---|---|---|---|
|
III. Total net assets, end of year |
149,492,088 |
162,433,443 |
165,748,850 |
199,967,871 |
201,577,165 |
243,309,088 |
Balance Sheet As of March 31st
I. Assets
(Unit: ¥1,000)
| FY 2020 | FY 2021 | FY 2022 | FY 2023 | FY 2024 | FY 2025 | |
|---|---|---|---|---|---|---|
| 1. Current assets | ||||||
| Cash and cash equivalents | 4,059,024 | 4,477,491 | 4,933,830 | 7,128,060 | 4,907,880 | 5,629,569 |
| Investments | 0 | 0 | 0 | 0 | 2,579,534 | 3,009,396 |
| Other current assets | 230,499 | 302,471 | 179,803 | 378,097 | 307,501 | 271,254 |
| Total current assets | 4,289,523 | 4,779,962 | 5,113,633 | 7,506,157 | 7,794,916 | 8,910,220 |
| 2. Fixed assets | ||||||
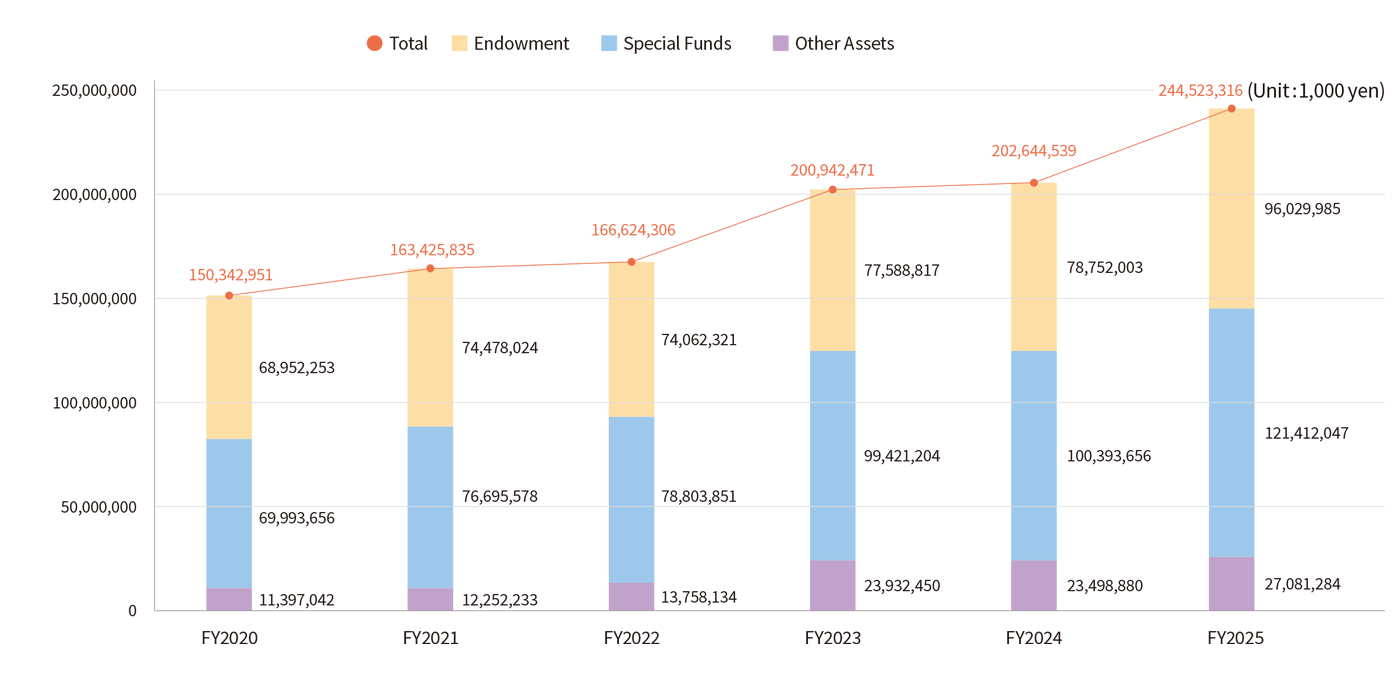
| Endowment | 68,952,253 | 74,478,024 | 74,062,321 | 77,588,817 | 78,752,003 | 96,029,985 |
| Special funds(special assets) | 69,993,656 | 76,695,578 | 78,803,851 | 99,421,204 | 100,393,656 | 121,412,047 |
| Other special assets | 2,570,407 | 3,132,359 | 4,434,146 | 12,377,118 | 11,329,633 | 13,692,850 |
| Other fixed assets | 4,537,112 | 4,339,912 | 4,210,355 | 4,049,174 | 4,374,331 | 4,478,215 |
| Total fixed assets | 146,053,428 | 158,645,873 | 161,510,673 | 193,436,313 | 194,849,623 | 235,613,097 |
| Total assets | 150,342,951 | 163,425,835 | 166,624,306 | 200,942,471 | 202,644,539 | 244,523,316 |
II. Liabilities
(Unit: ¥1,000)
| FY 2020 | FY 2021 | FY 2022 | FY 2023 | FY 2024 | FY 2025 | |
|---|---|---|---|---|---|---|
| Current liabilities | 497,731 | 632,939 | 511,417 | 647,815 | 754,445 | 822,206 |
| Long-term liabilities | 353,132 | 359,453 | 364,039 | 326,785 | 312,929 | 392,022 |
| Total liabilities | 850,863 | 992,392 | 875,456 | 974,600 | 1,067,374 | 1,214,228 |
III. Net assets
(Unit: ¥1,000)
| FY 2020 | FY 2021 | FY 2022 | FY 2023 | FY 2024 | FY 2025 | |
|---|---|---|---|---|---|---|
|
1. Net assets ― temporarily restricted |
113,804,916 |
123,645,000 |
122,922,071 |
133,305,793 |
134,800,923 |
164,539,025 |
| To endowment | (62,547,178) | (67,650,150) | (67,403,601) | (70,406,739) | (71,361,149) | (86,939,936) |
| To special assets | (51,257,738) | (55,994,850) | (55,518,471) | (62,899,054) | (63,439,774) | (77,599,088) |
| 2. Net assets ― unrestricted | 35,687,172 | 38,788,443 | 42,826,778 | 66,662,078 | 66,776,242 | 78,770,064 |
| To endowment | (6,405,076) | (6,827,874) | (6,658,720) | (7,182,079) | (7,390,854) | (9,090,048) |
| To special assets | (20,974,924) | (23,489,648) | (27,395,475) | (48,608,318) | (47,999,318) | (57,164,983) |
| Total net assets | 149,492,088 | 162,433,443 | 165,748,850 | 199,967,871 | 201,577,165 | 243,309,088 |
| Total liabilities and net assets | 150,342,951 | 163,425,835 | 166,624,306 | 200,942,471 | 202,644,539 | 244,523,316 |
Changes in Assets