




Introduction
Since the outbreak of the Iran war on February 28, 2026, unstable transit conditions in the Strait of Hormuz have sharply curtailed oil and natural gas exports from Middle Eastern producers. Against this backdrop, the United States has emerged as an increasingly critical supplier underpinning Asia’s energy procurement. At the same time, as the conflict drags on, questions are mounting over whether the United States can continue sustaining large scale energy exports to Asia.
In this article, I examine recent trends in Middle Eastern energy exports under wartime conditions and assess the extent to which US shipments have compensated for the shortfall in Asian markets. I then evaluate whether the United States can maintain sufficient export capacity going forward.
Declining Exports from the Middle East
Since the start of the Iran war, transit conditions in the Strait of Hormuz have fluctuated in response to US-Iran military tensions and the progress of ceasefire negotiations. Following Iranian threats and attacks on commercial vessels, daily transits through the strait fell from 95 on February 27—the day before the initial strike—to just 4 on March 2. Since then, US naval interdictions targeting Iranian vessels from mid-April generally kept traffic below 10 ships per day. After Washington and Tehran signed a memorandum of understanding toward a ceasefire on June 17, transit volumes began to recover, reaching 44 ships on June 24 and 43 ships on June 25.[1]
Yet the fundamental dispute over shipping lanes remains unresolved. Iran rejects the use of the Omani side of the strait and insists that vessels transit through Iranian waters, treating ships navigating the Omani side as legitimate targets. As a result, navigation has again become constrained, with daily transits falling below 10 ships from mid July onward.
These disruptions have depressed Middle Eastern energy exports. Crude oil and refined product shipments through Hormuz fell from 21.6 million barrels per day (b/d) in October–December 2025 to 14.9 million b/d in January–March 2026 and then plunged to 4.9 million b/d in April–June.[2]
Alternative routes bypassing the strait are limited. Saudi Arabia operates the East–West Crude Oil Pipeline linking the Abqaiq oil fields to the Red Sea port of Yanbu, with a capacity of 5–7 million b/d. The United Arab Emirates operates the Abu Dhabi Crude Oil Pipeline from the Habshan fields to Fujairah on the Indian Ocean side of the strait, with a capacity of 1.8 million b/d.
Saudi Arabia exported 7.15 million b/d of crude in February 2026, of which 6.34 million b/d transited the strait and 0.81 million b/d departed from Yanbu. After March, Riyadh accelerated rerouting to Yanbu, and by June, 4.32 million b/d of its 4.65 million b/d in exports were shipped from the Red Sea.[3]
The UAE has maintained exports through Fujairah and by employing “shuttle transfers”—tankers deactivating their automatic identification system transponders while transiting the strait, then transferring crude to buyer-chartered tankers in the Gulf of Oman. UAE exports rose from 2.17 million b/d in March to 4.26 million b/d in June.[4]
In contrast, Iraq, Kuwait, and Qatar—lacking bypass pipelines—have seen little recovery. In 2025, their Hormuz-dependent crude exports reached 3.32 million b/d (Iraq), 1.40 million b/d (Kuwait), and 0.73 million b/d (Qatar).[5] Shuttle transfers are reportedly being used for these producers as well,[6] but this has not been enough to restore volumes to prewar levels.
Moreover, as Iran seeks to tighten control over the strait, shuttle transfers conducted without Iranian consent carry significant security risks.Tankers linked to the Abu Dhabi National Oil Company were attacked on August 8, 13, and 14 while transiting the strait, with Iranian involvement suspected in each case. Although shuttle transfers offer a partial workaround, they are not a sustainable long term solution.
Liquefied natural gas shipments face even greater constraints. Nearly all of the 80 million tons in annual LNG exports from Qatar and the UAE—except those bound for Kuwait—transit Hormuz, accounting for about 20% of global LNG trade in 2025. Unlike crude, LNG has no viable pipeline bypass.[7] Qatar’s LNG exports, which averaged 6–8 million tons per month before the war, collapsed to around 1 million tons from March 2026 onward.[8]
The United States as an Alternative Supplier
With Middle Eastern oil and LNG supplies faltering, Asian importers are increasingly turning to the United States. The shale revolution of the 2010s dramatically expanded US oil and gas production, enabling the country to lift export restrictions. After Russia’s invasion of Ukraine in 2022, US exports to Europe surged, helping stabilize European energy procurement.[9] Today, US energy supplies have become strategically indispensable not only for Japan but for Washington’s broader network of Asian allies.
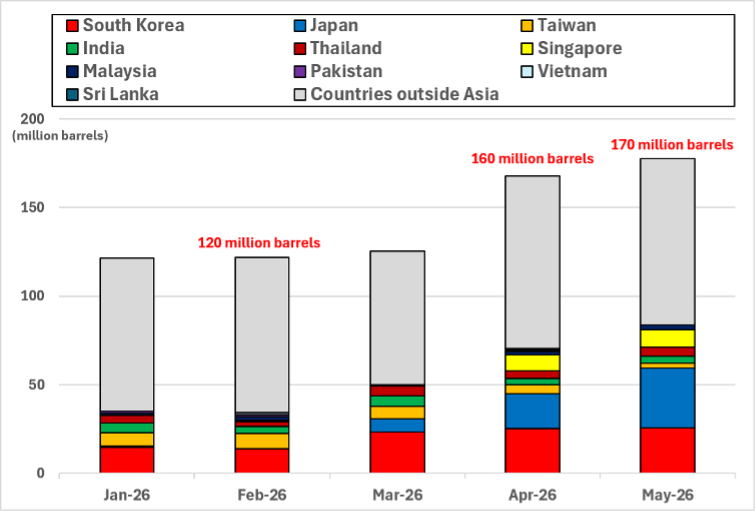
US exports of crude and refined products have risen sharply since the start of the Iran war. According to the US Energy Information Administration (EIA), crude exports increased from 120 million barrels in February 2026 to 160 million in April and 170 million in May.[10] Shipments from the main export hub on the Gulf of Mexico coast doubled between February and May.
Refined product exports also expanded between February and May: low sulfur distillates (diesel) rose by roughly 69%, jet fuel by 39%, and residual fuel oil used in marine bunkering by 51%. Liquefied petroleum gas exports increased as well: propane and butane—used as household and industrial fuel as well as petrochemical feedstocks—rose by 24% and 67%, respectively, while ethane—another key petrochemical feedstock—rose by 7%.[11] Naphtha exports, essential for petrochemical production, surged from 8.01 million barrels in February to 17.48 million barrels in March and remained high at 15.88 million barrels in April. The United States has thus emerged not only as a substitute crude supplier but also as a major source of immediately usable refined fuels.
A notable feature of US crude exports is the dramatic shift toward Asia. Shipments to Asia rose from 34.11 million barrels in February to 83.64 million in May, increasing their share of total US crude exports from 28% to 47% (Figure 1). Japan saw the largest increase—from 7.7 million barrels in March to 19.8 million barrels in April and 33.61 million barrels in May. Exports to South Korea have remained high at around 25 million barrels since March. Shipments to Thailand and Singapore have also expanded, while exports to Taiwan and India have remained steady. As Middle Eastern supplies falter, US crude is being increasingly prioritized for the Asian market.
Figure 1. US Crude Oil Export Destinations (January–May 2026)
America’s LNG exports have similarly shifted toward Asia. Comparing February and May 2026, exports to Japan increased by 515%, to South Korea by 568%, to Thailand by 262%, to India by 107%, and to Taiwan by 23%. Singapore, which had no LNG imports from the United States in February, imported 102.5 billion cubic feet in May. Meanwhile, Europe’s imports of American LNG have declined sharply—down 88% for the United Kingdom, 45% for France, and 89% for Turkey.[13] These shifts highlight the flexibility of American LNG in redirecting cargoes according to demand or market conditions.[14]
Growing Asian Dependence on US Energy
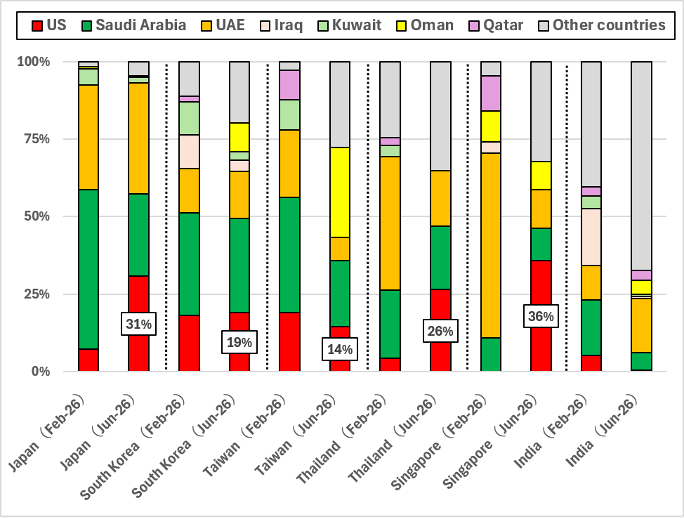
As US resource exports to Asia expand, the region’s dependence on US energy has risen markedly. Comparing import figures between February and June 2026, the share of US crude increased from 7% to 31% for Japan, 4% to 26% for Thailand, and 0% to 36% for Singapore; South Korea saw a modest increase from 18% to 19% (Figure 2). US crude has become a critical complement to Middle Eastern supply.
Figure 2. Share of US Crude in Asian Crude Imports (February and June 2026)
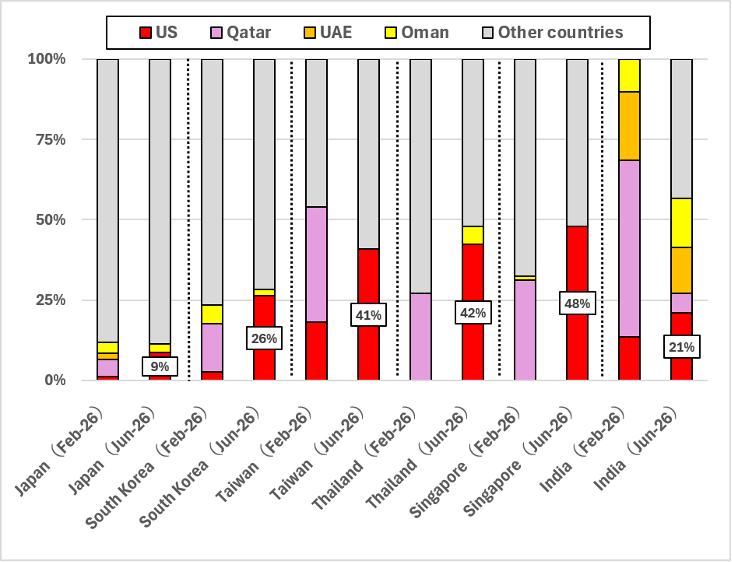
LNG imports from the United States have similarly risen sharply. Between February and June, the US share of imports increased from 1% to 9% in Japan,[15] from 3% to 26% in South Korea, from 18% to 41% in Taiwan, and from 13% to 21% in India. Thailand and Singapore—both of which imported no LNG from the United States in February—saw US shares rise to 42% and 48%, respectively (Figure 3). With no clear timeline for the full resumption of Qatari and UAE LNG exports, American LNG has become a vital alternative source.
Figure 3. Share of US LNG in Asian LNG Imports (February and June 2026)
The Outlook for US Export Capacity
US crude exports have played a central role in mitigating the impact of Middle Eastern supply disruptions. However, sustaining current export levels is becoming increasingly uncertain. US crude production rose from roughly 380 million barrels in February 2026 to 420 million barrels in March but remained flat through April and May.[16] The surge in exports has therefore been supported not by higher production but by drawdowns from commercial inventories and the Strategic Petroleum Reserve (SPR).
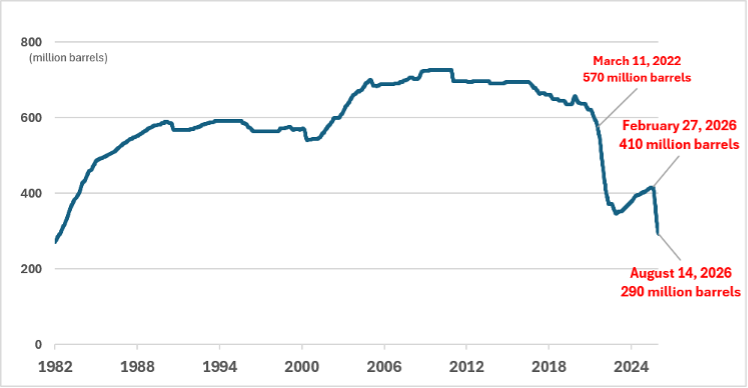
SPR stocks have fallen from roughly 410 million barrels on February 27 to about 290 million barrels on August 14 (Figure 4). This steep decline raises concerns about the US ability to maintain high export levels. After the war began, Washington committed to releasing 170 million barrels from the SPR as part of an International Energy Agency coordinated emergency action. The problem is that the United States entered the conflict without sufficient reserves: the Biden administration released 180 million barrels in 2022 to counter price spikes following Russia’s invasion of Ukraine, but subsequent replenishment never restored the SPR to pre release levels.
Commercial crude inventories remain at roughly 420 million barrels as of August 14, but with limited prospects for substantial increases in domestic production,[17] US capacity to offset new supply shocks—such as a potential shutdown of Saudi or UAE bypass pipelines—is gradually diminishing. If Washington prioritizes domestic gasoline price stability, it may restrict further SPR releases or reduce overseas crude shipments.
Figure 4. US SPR Inventory Levels (1982–2026)
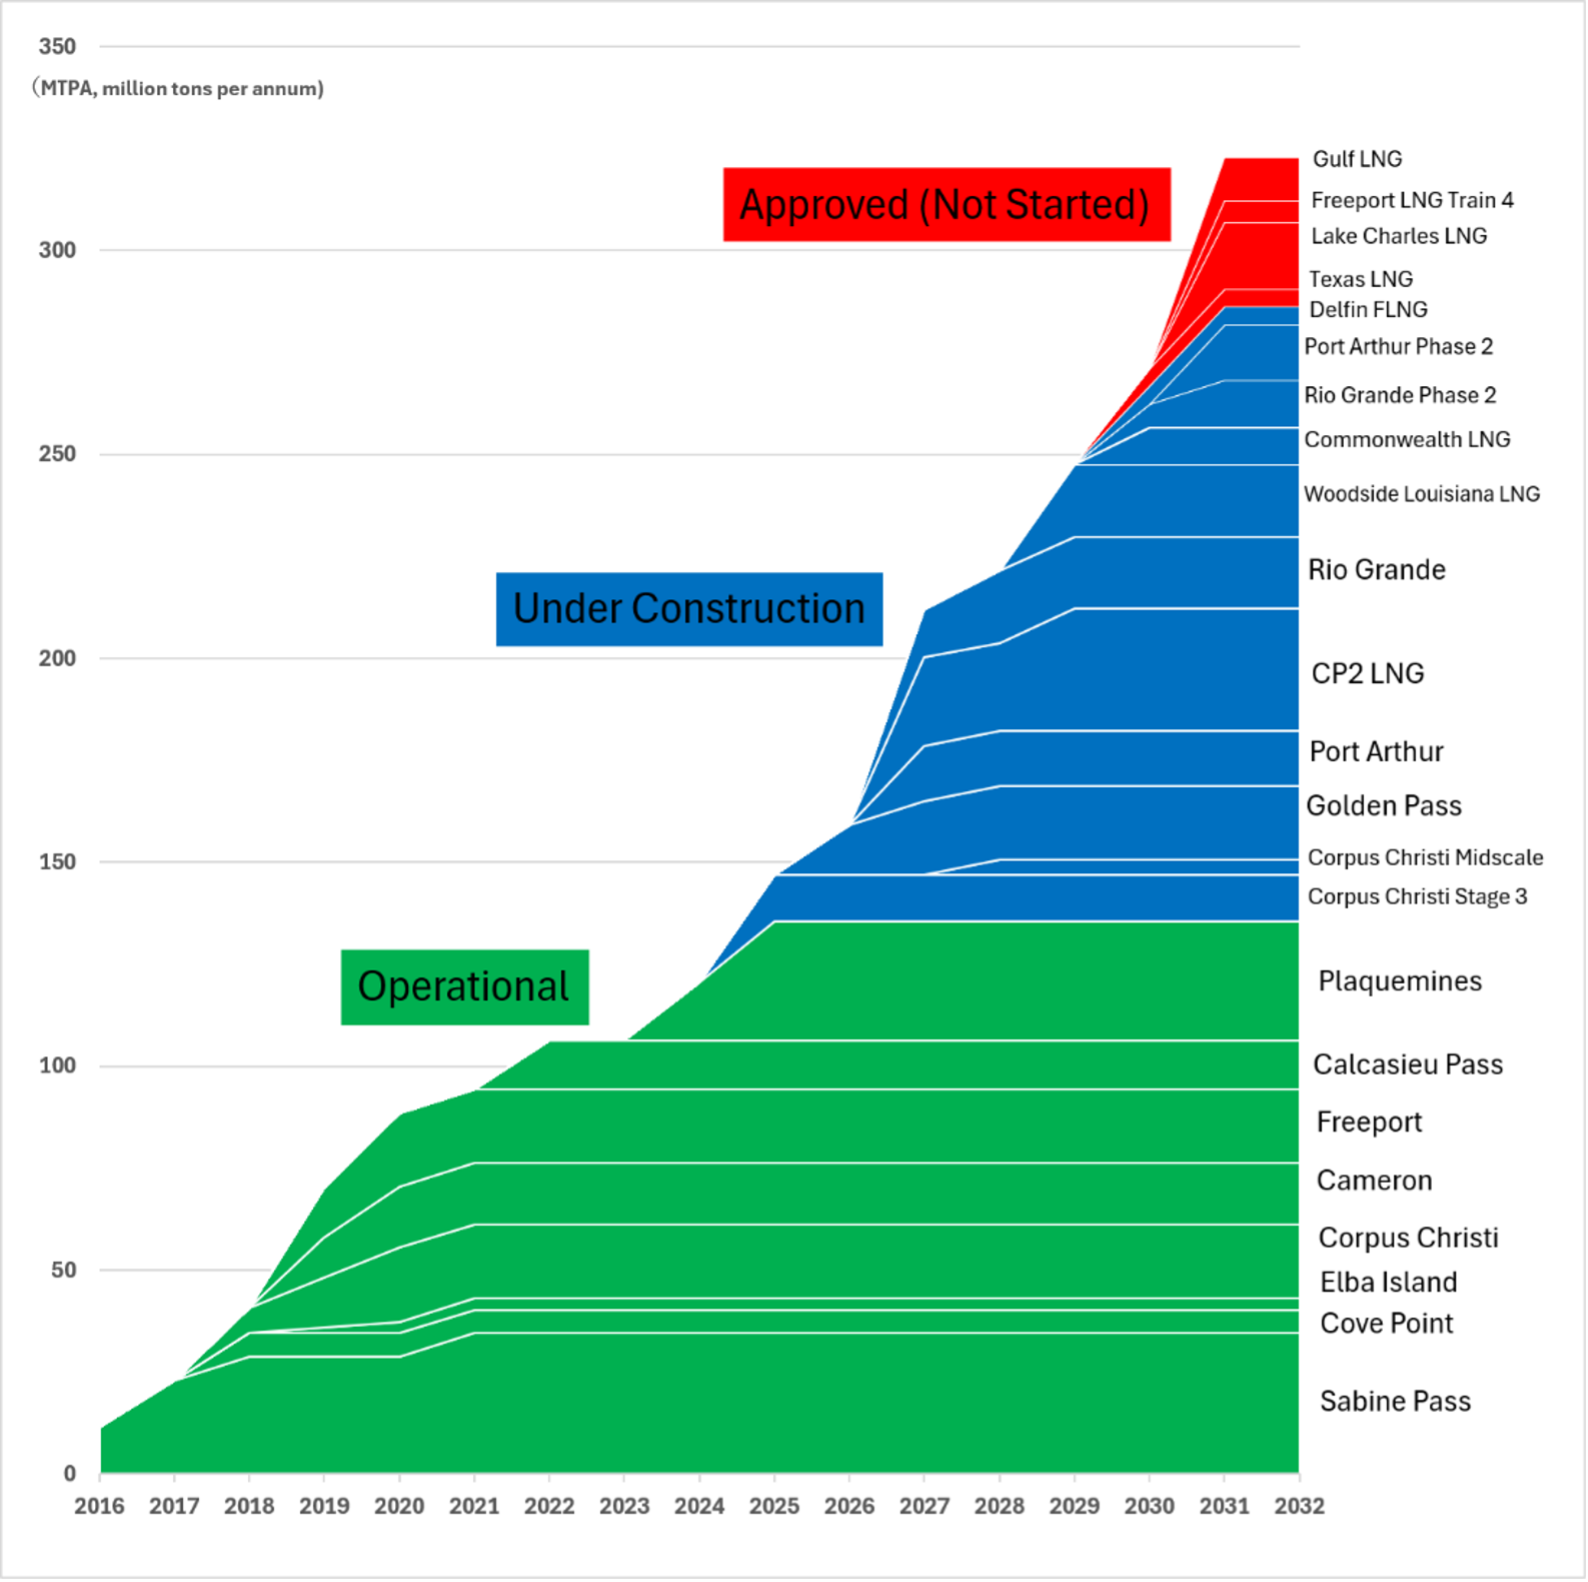
As for LNG, the key constraint had been liquefaction capacity rather than production. Existing facilities have primarily reallocated cargoes among destinations, but starting in 2027, US liquefaction capacity is expected to expand significantly. According to the EIA, peak nameplate capacity stands at roughly 160 million tons per year in 2026 and is projected to reach 210 million tons in 2027. Large projects under construction in Texas and Louisiana—and facilities already approved but whose construction has not yet started—could push capacity above 300 million tons by around 2030 (Figure 5).
This expansion will enhance US ability to meet rising demand in both Europe and Asia. If Iran maintains a hardline stance over control of Hormuz, and LNG exports by Qatar and the UAE remain constrained, Asian importers will likely deepen their reliance on US supply. For Japan in particular, any reduction in reliance on Russian LNG—depending on the trajectory of the Ukraine conflict—would further elevate the strategic importance of US supply.
Figure 5. Outlook for US LNG Liquefaction Capacity (2016–2032)
However, expanding LNG exports will require the United States to not only increase domestic natural gas production but also make substantial investments in pipeline infrastructure linking production basins to liquefaction terminals. For Asian consumers seeking to increase their reliance on US LNG, it will be important—on energy security grounds—to consider investments not only in long term procurement contracts but also in upstream development and pipeline networks.
(2026/09/07)
Notes
- 1 “Port Monitor: Strait of Hormuz,” IMF Portwatch, accessed August 23, 2026.
- 2 “Short Term Energy Outlook: Global Energy Security Data,” US Energy Information Administration, August 12, 2026.
- 3 Julian Lee, “Saudi Oil Shipments Slip in July as Red Sea, Hormuz Risks Grow,” Bloomberg, August 4, 2026.
- 4 Yongchang Chin and Alex Longley, “UAE Defies Hormuz Risks to Keep Crude Flowing to Global Market,” Bloomberg, August 6, 2026.
- 5 “Strait of Hormuz Factsheet,” International Energy Agency, February 2026.
- 6 Alex Longley et al., “Covert Mideast Oil Flows Are Keeping Global Prices in Check,” Bloomberg, August 16, 2026.
- 7 The Dolphin Gas Pipeline carries Qatari gas through the UAE to Oman on the Indian Ocean side of the Strait of Hormuz. However, the gas transported via this route is consumed domestically—used as fuel for power generation in the UAE and for enhanced oil recovery aimed at maintaining and increasing crude output in Oman. As a result, Oman does not liquefy this gas for export to third‑country markets.
- 8 Andrew England, “Qatar Cuts State Spending at Home and Abroad as War Shrinks Economy,” Financial Times, August 22, 2026.
- 9 See my earlier article (in Japanese) on the United States as an oil and gas exporter to Europe, International Information Network Analysis (IINA), July 24, 2023.
- 10 “Petroleum & Other Liquids: Exports,” EIA, accessed August 23, 2026.
- 11 LPG is a liquefied hydrocarbon gas—primarily propane and butane—produced during crude oil and natural gas extraction or in the course of petroleum refining. LNG, by contrast, is natural gas composed mainly of methane that has been purified to remove water, sulfur compounds, carbon dioxide, and other impurities, then cooled to roughly –160°C for liquefaction. See the definitions (in Japanese) for LPG and LNG on the JOGMEC Journal page of the Japan Oil, Gas, and Metals National Corporation.
- 12 “Petroleum & Other Liquids: Exports by Destination,” EIA, accessed August 23, 2026.
- 13 “Natural Gas: US Natural Gas Exports and Re-Exports by Country,” EIA, accessed August 23, 2026.
- 14 See my earlier article on this website, “US LNG Exports and the Impact of Climate Change Measures: How Will the Presidential Election Change Things?” IINA, September 9, 2024.
- 15 Japan’s relatively low dependence on US LNG reflects large, stable imports from Australia and continued imports of Russian LNG, even after the start of the war in Ukraine. In 2025, Japan imported 25.81 million tons from Australia (40% of the total), 9.61 million tons from Malaysia (15%), 5.80 million tons from Russia (9%), and 4.51 million tons from the United States (7%). Imports from Qatar and the UAE totaled 3.42 million tons (5%) and 0.67 million tons (1%), respectively.
- 16 “Petroleum & Other Liquids: Crude Oil Production,” EIA, accessed August 23, 2026.
- 17 According to its latest Short‑Term Energy Outlook, the EIA projects that US crude oil production will rise only modestly, from an average of 13.8 million b/d in 2026 to 14.2 million b/d in 2027. See “Short‑Term Energy Outlook: Overview,” EIA, August 11, 2026.
- 18 “Petroleum & Other Liquids: Weekly Stocks,” EIA, accessed August 25, 2026.
- 19 “US Liquefaction Capacity 2Q 2026,” EIA, June 30, 2026.