Piracy and Armed Robbery against Ships up to the First Half of 2012
-Characteristics viewed in the IMB Report-
Hideshi Ueno,Research Fellow, Ocean Policy Research Foundation
Contents
On July 15, the International Maritime Bureau (IMB) of the International Chamber of Commerce (ICC) published a report on the incidents of piracy and armed robbery against ships noted in the world during the first half of 2012 (January 1−June 30) through the Piracy Reporting Center(PRC)based in Kuala Lumpur. Below is a summary of the characteristics of the incidents of piracy and armed robbery against ships viewed from the IMB report (hereinafter referred to as Report) noted during the first half of 2012.
Regarding the definition of Piracy and Armed Robbery against Ships, the IMB accepts the “definition of piracy” in Article 101 of the United Nations Convention on the Law of the Sea (UNCLOS). As for the armed robbery, the IMB accepts the definition of the “Code of Practice for the Investigation of the Crimes of Piracy and Armed Robbery against Ships” which was adopted by the International Maritime Organization (IMO) in November 2001.
1. Characteristics viewed from numbers and locations of the incidents (including attempted attacks)
The number of the incidents reported during the first half of 2012 was 177 (266 during the same period in 2011). Of them, 100 (128 during the same period in 2011) were actual attacks. Of them, 20 (29 during the same period in 2011) were cases hijacked, and 80 (99 during the same period of 2011) were cases boarded. There were 77 (138 during the same period in 2011) attempted attacks. Of them, 25 (76 during the same period in 2011) were cases fired upon, and 52 (62 during the same period of 2011) were cases attempted. However, the IMB is regarding there are a great number of the unreported cases apart from the reported cases, advising the shipping owners and captains of the ships to report all piratical attacks and suspicious movements of the crafts to the bureau.
The number of 177 attacks noted during the first half of 2012 showed a remarkable decrease, compared with the number of 266 attacks (439 attacks throughout the year) noted during the same period in 2011. The trends of attacks during each first half of the recent six years are as shown in the Table 1. Looking at the attacks by location, of 177 attacks, 118 attacks which occupy 66% of the total have occurred in the five locations below. Looking at the attacks in order of a higher frequency, as shown in the Table 2, there are 44 attacks off Somalia including the Indian Ocean (125 during the same period in 2011), 32 attacks in Indonesia (32 during the same period in 2011), 17 attacks in Nigeria (6 during the same period in 2011), 13 attacks in the Gulf of Aden (20 during the same period in 2011), and 12 attacks in the Red Sea (18 during the same period in 2011). This trend shows a huge increase in Nigeria and Indonesia.
The number of incidents (attacks) in the Gulf of Aden, off Somalia (including the Indian Ocean), and the Red Sea in the surrounding waters of the “Horn of Africa” totals 69, which distinctly indicates a huge decrease compared with 163 in the same period of 2011. Especially, the number of incidents in off Somalia (including the Indian Ocean) totals 44 compared with 163 in the same period of 2011, which indicates nearly the one-third decrease.
According to the Report, of 69 attacks, 13 hijacked incidents (4 in the Gulf of Aden and 9 off Somalia, including the Indian Ocean), 1 boarded incident (off Somalia, including the Indian Ocean) were noted. 217 seafarers have been taken hostage, 1 (3 in the same period of 2011) has been injured and 2 (7 in the same period of 2011) killed. As of the end of June 2012, 11 ships and 174 crews are still detained. Additionally 44 crews are abducted on land, pulled up from sea.
According to the report, the decrease in the number of incidents in off Somalia is attributed to the deployment of naval forces, the practical use of anti-piracy manual such as BMP (the Best Management Practices), the self-defense measures of vessels, the increase on employment of private armed guards such as PCASP (Private Contracted Armed Security Personnel), and the EU fleet’s attacks to the base of Somali pirates.
On the other hand, Somali pirates continue to threaten an extended geographical region, which covers from the southern part of the Red Sea in the west to 76 degrees East longitude and 25 degrees North latitude in Gulf of Oman to 22 degrees South latitude, and use hijacking vessels and dhows as their mother boat. According to the report, while it is estimated that a number of incidents executed by Somali pirates in the Indian Ocean and the Arabian Sea decrease, affected by difficulty of using small boats due to monsoon season from June to beginning of September, incidents likely increase in the unaffected areas.
Other part, the situation in the Gulf of Guinea on the west coast of Africa is deteriorating. The number of incidents rise 32 including 5 hijackings from 25 in the same period of 2011. Especially off Nigeria is the hot spot of achieving remarkable increase, showing 17 attacks including 3 hijacked incidents, 7 boarded incidents and 61 people abducted from 6 attacks in 2011. In cases of attempted, 7 boarded incidents and 6 shooting incidents occurred. And guns were used at least 20 of the 32 incidents and 1 crew member was killed and another also died.
As the Table 1 shows, in Southeast Asia, the number of incidents in Indonesia are 32, increasing by 20% from 21 in the same period of 2011. In Indonesia, the incidents have most frequently occurred in the vicinity off Anambas, Natuna, Mangaki, Subi, Merudung, Jakarta Tanjungpriok, Dumai and Taboneo in the South China Sea. But the most of cases are low-intensity robbery, targeting anchored vessels by armed men with knives or hatchets. Furthermore, as the Table 2 indicates, there was 1 hijacked incident each in the Strait of Malacca and the South China Sea.
2. Characteristics viewed from activities
The Table 2 shows the status of attacks by location noted frequently in the areas in Asia and others up to the half of 2012. The Table 3 shows the status of ships attacked, including the attempted cases, by location in 2012.
Analyzing the table 2 and 3, the distinct feature of attacks by Somali pirates can be discovered. All the attacks including attempted cases occurred at time when vessels were streaming and the mother-vessels and small high-speed boats were often used.
In Southeast Asia, the feature is that many of the cases were boarded incidents and occurred at time when vessels were anchored. In the case of Strait of Malacca, a Malaysian fishing vessel PKFB 1340 (C) was hijacked by armed pirates but the Malaysian Authorities rescued all crew members. Another hijacked one was reported in South China Sea, which a Malaysian tugboat TB Wantas 6 and barge Wantas VII was attacked while underway from Singapore Straits to Tawau.
In the first half of 2012, ports and anchorages which were attacked more than three times are recorded at 7 different places (8 in 2011) and the number of incidents totally is 33 (37 in 2011). According to the report, the 7 places are Dumai (8 attacks, twice as many as 4 in 2011), Chittagong in Bangladesh (6 attacks), Lagos in Nigeria (5 attacks), Lome in Togo (5 attacks), Abidjan in Ivory Coast (3 attacks), El Dekheila in Egypt (3 attacks) and Taboneo in Indonesia (3 attacks).
What types of vessels were attacked as the targets of the pirates/robbers? The number of ships involved in attacks including attempted cases is noted as follows. The highest number is 39 Bulk carriers and the following are 33 chemical tankers, 26 containers, 22 crude oil tankers, 13 product tankers, 8 general cargos, 6 tugs and 6 LPG tankers. Moreover it is outstanding that the attacks for general cargo dramatically decrease from 20 attacks in the same period of 2011. Somali pirates hijack various kinds of vessels and the report indicates that they have an ad hoc tendency.
In terms of flag states, totally 177 attacks are reported in the first half of 2012 and 33 of the all are occupied by Liberia-registered vessels. The following are 26 Panama-registered vessels, 24 Singapore-registered vessels, 11 Hong Kong-registered vessels, 9 Marshall-registered vessels and 6 Malta-registered vessels. No Japan-registered vessels are attacked while 4 cases were reported in the past 6 years (1 in 2007, 2 in 2008 and 1 in 2011).
Other part, focusing on countries where victim ships controlled/managed, it is obvious that the highest number of 37 were given to Singaporean vessels. The following are 25 Greek and Germany vessels, 10 Hong Kong vessels, 8 UK’s vessels, 7 Indian vessels and 6 Danish vessels. Japanese vessels which were attacked remarkably decrease 3 from 12 in the same period of 2011.
3. Types of violence to crew and peculiarities of weapons used
Looking at the damages to crews, as the Table 4 shows, the most of incidents are occupied by situations which crews were taken hostages or abducted in the past 6 years. But the number of people who were involved in the incidents in the first half of 2012 record 334, which indicate dramatic decrease compared with the same period in 2011. In the 334 people, as 38 were taken hostages in the Gulf of Aden and 179 were in Somalia, the vast majority of the incidents are concentrated in off Somalia. Other part, the number of people who were taken hostages in Nigeria recorded 61. The following are 5 in Indonesia, 6 in the Strait of Malacca, 11 in the Strait of Singapore, 7 in the South China Sea and 1 in Vietnam.
The Table 5 shows types of arms used by pirates in all incidents in the first half of the past 6 years. There are few changes in the trend that guns and knives are major arms of pirates for the past 6 years. Other part, focusing on the types of arms used by pirates by location, of a total of 78 attacks in which guns were used, 12 cases in the Gulf of Aden, 5 cases in the Red Sea and 33 cases in Somalia, which the most of cases were conducted by Somali pirates, were noted. This indicates that how dangerous Somali pirates armed with AK-47 rifles and RPG-7 rocket weapons are. The number recorded 17 attacks in Nigeria and 2 in Togo, which shows violent characteristics of pirate attacks frequently using guns in the waters in the Gulf of Guinea. In the cases of Southeast Asia, knives are more frequent than guns. Of a total of 39 attacks in which knives were used, Indonesia overwhelmingly recorded 15 attacks. Furthermore, the cases of “Not stated” were recorded 58 in all the 177 incidents and Indonesia recorded the highest number 14. The following are 11 attacks in Somalia and 7 in the Red Sea.
Table 1: Trends of incidents (including the attempted attacks) that occurred frequently in Asia and other areas in the first half of the recent six respective years
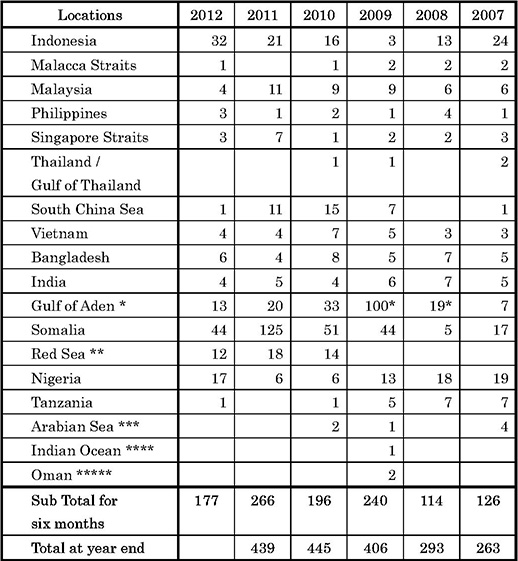
Source: Made from Table 1 in the Report during the first half of 2012, pp.5-6. The total of the incidents covers all areas targeted in the Report.
Remarks: *: Gulf of Aden; **: Red Sea; ***: Arabian Sea; ****: Indian Ocean; *****: Oman – All of the above attacks are attributed to Somali pirates.
Table 2: Status of attacks noted frequently in areas in Asia and others in the first half of 2012
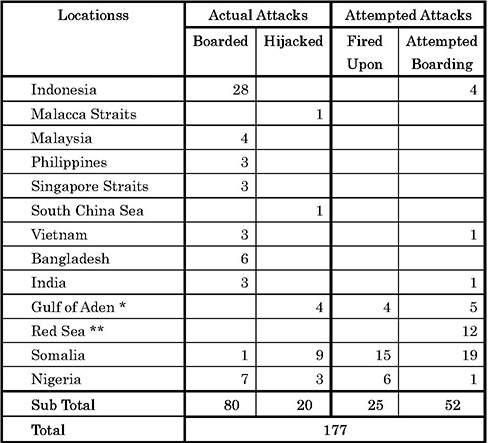
Source: Made from Table 2 in the Report during the first half of 2012, p. 9. The total of the incidents covers all areas targeted in the Report.
Remarks: *: Gulf of Aden; *: Red Sea; ** -All of the above attacks are attributed to Somali pirates.
Table 3: The status of the ships during attacks by location noted in the first half of 2012
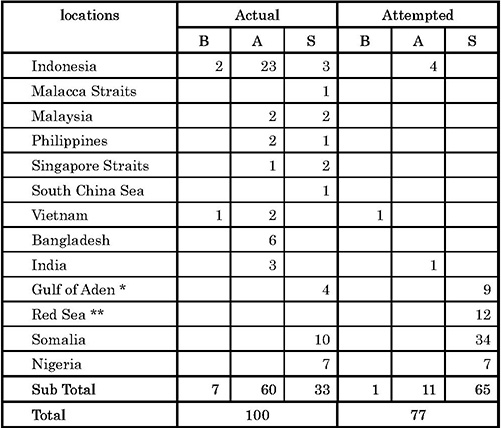
Sources: Made from Table 4 and Table 5 in the Report during the first half of 2012, p. 10-11. The total of the incidents covers all areas targeted in the Report.
Remarks: B = Berthed, A = Anchored, S = Steaming *: Gulf of Aden; *: Red Sea; ** -All of the above attacks are attributed to Somali pirates.
Table 4: Types of violence to crew in the first half of a year throughout the recent six years
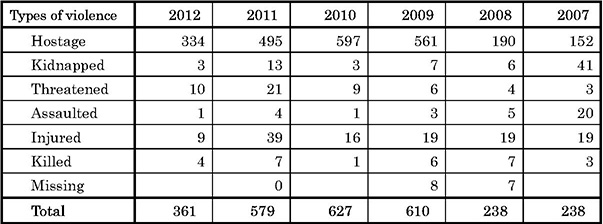
Source: Made from Table 8 in the Report during the first half of 2012, p. 12.
Table 5: Types of arms used by pirates during all attacks in the first half of a year throughout the recent six years
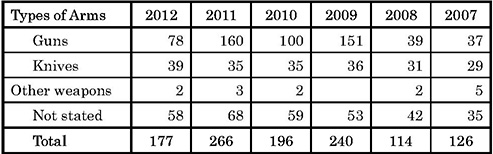
Sources: Made from Table 6 in the Report during the first half of 2012, p. 11.
From “Intelligence Analysis (July 2012)”
関連記事