Somali Piracy’s Impact on the Global Economy Various Cost Estimates of Anti-piracy Efforts from U.S. Think Tank Report
Contents
On February 8, the project “Oceans Beyond Piracy” by The One Earth Future Foundation in Colorado, the United States, issued The Economic Cost of Somali Piracy 2011 (hereinafter the report). According to their study, the sea transportation industry shouldered 80 percent of Somali piracy’s impact on the global economy, and the remaining 20 percent was the expense of each country’s government for anti-piracy efforts. The report says, the total cost is estimated to reach $6.6~6.9 billion (estimated amount of money in US$ unit; the same shall apply hereinafter). The report takes nine factors in estimating Somali piracy’s impact on the global economy by calculating related costs with various information materials together. Analysis of this monthly report will provide a brief introduction to each cost estimate below. Related tables will appear at the end for the convenience of the description.
1. Ransoms: $159.62 million
According to available data, 31 ransoms were paid in 2011, amounting to a total of $159.62 million, with the average ransom being $4.97 million, which increased from about $4 million of 2010 (see Table 1).
The success rate of pirate attacks in 2011 has declined from 27% in 2010, to 13% in 2011, but pirates has been securing equal or greater value for less hijacked vessels. The highest ransom paid on record in 2011 was $13.5 million to release the Greek flagged Very Large Crude Carrier (VLCC) Irene SL (released on April 7). The former highest ransom on record had been paid to release the Marshall flagged oil tanker Samho Dream (hijacked on April 4 2010 and released on November 6 2010) operated by a South Korean shipping company for $9.5 million. The two VLCCs were laden with crude oil. On average it took 178 days, or around six months for a ransom to be negotiated, and a ship released.
2. Piracy Insurance: $635 million
(1) According to the report, War Risk and Kidnap and Ransom (K&R) are the two primary forms of piracy-related insurance. Vessels transiting through ‘war risk areas’ are required to pay war risk premiums. War risk areas are identified by the Lloyds Market Association (LMA) Joint War Committee, in London. The report says, as of January 2011, the War Risk zone covers a very large portion of the Indian Ocean, the Gulf of Aden, the Red Sea and the Gulf of Oman. War risk premiums may be reduced if ships have armed security guards, or other security equipment such as citadels, razor wire, or sonic deterrent equipment.
(2) K&R insurance typically protects the crew. The report says that K&R can add a useful additional layer of insurance protection to war risk insurance, and is often used to cover fees for public relations, negotiators, medical and psychological treatment, ransom delivery costs, and travel costs for hostages’ families.
(3) The report says, although it is difficult to quote insurance, the number of ships transiting the war risk area was used as the basis of the estimation. Best Management Practices Version Four (BMP4) requires tall ships transiting the High Risk Area (HRA) to register with EUNAVFOR’s Maritime Security Center Horn of Africa (MSC HOA). According to the report, the number of the transiting ships was figured out as below. Based on the number of vessels registering with MSC HOA between January and August 2011, the average number of vessels transiting each month is around 2,830. As a result, the number of vessels transiting in 2011 was estimated at around 33,960 vessels. Beside this, given that the number of vessels adherence to BMP4 and the registration of vessels to MSHOA is estimated to be around 80% compliant, the total number of vessels transiting is likely to be around 42,450 per year.
(4) The report made an estimate of $420,287,250 for war risk and $214,620,000 for K&R insurance, taking various factors into consideration based on 42,450 vessels as an estimation standard. Thereby, the report estimates piracy-related insurance premiums at around $635 million.
3. The Cost of Security Equipment and Guards: $1.064~1.16 billion
(1) BMP4 requires vessels transiting the HRA to take a number of security measures to prevent and defend against a pirate attack. For example, (a) watch keeping and enhanced vigilance, (b) enhanced Bridge Protection and control of access to bridge, (c) razor wire, (d) water spray and foam monitors, (e) maneuvering practice, (f) Closed Circuit Television (CCTV), (g) Upper Deck lighting, (h) alarms, (i) Citadels.
As mentioned earlier, BMP4 compliance rates are estimated to be at 80%, and the number of vessels transiting is estimated to be 33,960 vessels. Based on this, the total cost of security measures is estimated at $533,609,653~$629,248,653.
(2) In 2011, as a deterrent mechanism against pirate attacks, the number of cases that ship owners deployed private armed security on commercial vessels transiting the HRA rapidly increased. A number of flag states permitted the use of armed security onboard ships (such as Cyprus, Denmark, Finland, Germany, Greece, Hong Kong, India, Italy, the Netherlands, Norway, Spain, the United Kingdom and the United States). The use of armed guards was also endorsed by the International Maritime Organization (IMO), the International Transport Workers’ Federation (ITF), and some insurance companies.
According to British security guard private company, the employment of private armed guards acted as a deterrent. Managing Director of British Protection Vessels International Ltd. (PVI) on October 18, 2011 revealed that the armed guards were composed of only former Royal Marines. He also said, PVI charged a flat daily rate and the average cost was $50,000 a voyage. The average journey lasted eight days. PVI’s guards had come under attack 30 times in 3 1/2 years, but warning shots were enough to repel all the assaults without incurring any deaths or injuries, he said. (Bloomberg.com, October18, 2011)
In addition to the employment of private security guards, some countries take their military personnel on their own flag ships. For example, Thailand put four members of its armed guard units aboard each Thai merchant vessel to provide protection until it traveled out of the piracy-prone sea lanes in the Gulf of Aden from July to the end of November, 2011. Italy changed its laws in August 2011 to allow groups of six Italian Navy marines to travel on commercial ships. There are currently 60 marines seconded on this kind of duty. On the night of February 15, 2012, the security personnel of the Italian flagged tanker MT Enrica Lexie (104,769DWT) operated by an Italian shipping company fired and killed two Indian fishermen by accident off the coast of Kerala, South India, mistaking an Indian fishing ship for a pirate ship.
The report estimates that approximately 25% of vessels transiting the HRA employed armed guards in 2011. This figure of 25% is an estimation of the entire year of 2011. The report considers that by the end of the year this figure was closer to 50% of vessels. Moreover, if there are approximately 42,450 transits through the HRA each year, then around 10,612 transits employ armed security. At an average cost of $50,000 per transit, the total costs of private armed security are estimated to be in the region of $530.6 million per year.
In addition to the costs of security equipment and guards to the shipping industry, the report also estimates a cost to pay an accreditation body to authorize private security companies. According to the results, the Security Association for the Maritime Industry (SAMI) is the main such accreditation body, and on average members pay $3,824 per year. Since the organization has approximately 76 members, the total costs of licensing accreditation is around $290,624 per year.
(3) As explained above, the report estimates the cost of this field at $1.064~1.16 billion.
4. Re-routing: $486~680 million
(1) According to the report, owing to some factors, the number of ships opting to re-route around the Cape of Good Hope to avoid attacks by pirates decreased significantly in 2011. Firstly, shipping companies have increasingly placed private armed security on their ships. Until now, no ship with armed guards is believed to have been successfully hijacked. Therefore, many ship owners appear to find paying for armed security and transiting directly through high-risk zones to be more cost effective than re-routing around the Cape of Good Hope. Secondly, as pirates expanded their area of operation, the war risk zone has been extended into the larger Indian Ocean. Below is how the pirates’ area of operations has expanded over the past few years.
Thirdly, Suez Canal revenues reached record levels in 2011, which suggests that there was not a substantial re-direction of shipping traffic away from the Suez. In August 2011, Egypt’s Suez Canal Authority announced that despite political turmoil in Egypt and surrounding countries, the waterway had collected a record $5.05 billion in the 2010/11 fiscal year, with revenues collected by the Authority increasing by 12.7% on the same period in 2010.
According to the report, the feature of the re-routing in 2011 was that of ships hugging the Western Coastline of India, in an attempt to transit around the east side of the piracy risk zone. This more moderate model of re-routing adds approximately one excess day to an average transit between Singapore and Oman.
(2) Since it was difficult to determine how many ships opted to re-route when the cost of re-routing was estimated, the report opted to conservatively focus on two vessel types -tankers and bulk carriers – given their slower speed and lower bridge, which places them at greater risk of hijack by pirates. In addition, some tankers were reluctant to have armed guards on board (due to the possibility of live weapons igniting fuel transported by tankers), and were therefore more susceptible to attack. To begin with, the report estimates that 8,375 tankers and 6,626 bulk carriers out of 42,450 ships transited the HRA in 2011.
(3) Since the report was not able to access data on the precise number of each vessel type opting to re-route away, it therefore estimates the cost of re-routing to tankers and bulk carriers when 50% of vessels re-route, and when 70% of vessels re-route. Under these specific scenarios, the cost of re-routing in 2011 was between $486 million and $680 million.
5. The Cost of Increased Speeds: $2.7 billion
(1) According to the report, there was no successful pirate attack on a vessel travelling at 18 knots or faster. BMP4 therefore recommends that vessels transit at least 18 knots, throughout their transit of the HRA. As a matter of course, this increased speed is an added cost to vessels given that they are transiting at higher speeds than their most ‘economically optimum’ speed.
(2) The report picked container ships up for their cost calculation of the increased speeds. Container ships over the past couple of years were traveling substantially slower than their full-speed capacity to decrease fuel consumption and costs, although capable of higher speeds than any other class of ship. For example, according to AP Moller-Maersk, the world’s largest container ship company, in 2010, AP Moller-Maersk mandated its ships to sail at 12 knots, also known as ‘super slow steaming.’ A report in 2010 also found the average speed of container ships to be 11.4 knots. The report estimates that the average speed of container ships ‘in the absence of piracy’ is 12 knots. In addition, the report calculates the cost of the increased speeds with assumptions below:
(a) When vessels are transiting South/North through the Indian Ocean, they are traveling at an increased speed of 13 knots (up from their ‘economically optimum’ speed of 12 knots).
(b) When vessels transit towards the Northeast of Somalia and through the Gulf of Aden, they are traveling at speeds between 18 and 20 knots. The report assumes two typical voyages to be from Oman to Yemen and from Pakistan to Yemen.
(c) 20% of container ships in the HRA do not transit the Indian Ocean at all (they are transiting East/West between the Gulf/Europe through the Gulf of Aden). Approximately 16,165 container ships transited the HRA in 2011, 20% of container ships is 3,233 vessels.
(d) The transits of the remaining 80% (12,932 vessels) is calculated such that for approximately 50% of their voyage (i.e. 1,613nm from Sri Lanka to Pakistan) they travel at around 13 knots; and for the remaining 50% of the voyage (i.e. 1,601nm from Pakistan to Yemen), at 18 knots:
(3) Under the specific scenarios and assumptions discussed above, the report calculates that the excess cost of container ships transiting at increased speeds through the HRA was approximately $2.7 billion in 2011.
6. The Cost of Labor: $195.06 million
(1) In 2011, 1,118 seafarers were held hostage by Somali pirates, and 24 killed, the report says. According to an agreement worked out between the ITF, ship owners and companies, during the period of transit of the HRA, seafarers shall be entitled to compensation amounting to 100% of the basic wage and a doubled compensation payable in case of death and disability. In addition, the Philippine Government requires that all contracts with Filipino seafarers include a provision for hazard pay in the form of 200% of wages when transiting the HRA. Filipino seafarers account for around 25% of all seafarers.
(2) The report assumes, as it takes approximately seven days to transit the area and hazard pay is equal to wages of approximately $2,100 per vessel per day, the cost per vessel is approximately $14,700. In addition, if all crews aboard the 42,450 vessels that transit the HRA each year received hazard pay, the cumulative cost would be around $624 million. However, not all ship owners have signed the agreement. The report therefore assumes that crews on 30% of vessels received hazard pay, amounting to around $187.2 million.
(3) The ITF agreement also provides for 200% compensation for seafarers held hostage in the region. According to the report, there were 28 vessels hijacked in 2010 that remained in Somali pirate control in all or part of 2011, and 25 more captured in 2011, for a total of 53 vessels carrying 1,118 seafarers. If the report uses an average of 20 seafarers per vessel (derived from the average for all ships held captive in 2011) and the estimate of total wages on the average ship to be $2,100, $39.1 million would have been distributed to seafarerhostages and their families. However, if the report calculates seafarer-hostage compensation only for all Filipino seafarers and the crews aboard vessels subject to the ITF agreement. In 2010, Filipino seafarers accounted for 20% of all hostages held, while 5 of the 53 hijacked vessels were subject to the ITF agreement. Therefore, labor costs for seafarers in captivity totaled around $7.87 million in 2011.
(4) As stated above, the report estimates that the total excess piracy-related labor cost for seafarers in 2011 was approximately $195 million.
7. The Cost of Prosecutions and Imprisonment: $16,429,631
(1) According to the report, over the past few years, approximately 1,089 pirate suspects have been arrested for piracy, and have either been tried or are awaiting trial in 20 countries. Table 2 shows the details of each country. To calculate the average cost of pirate trials and of imprisonment for suspected Somali pirates, the report divides countries into four groups: Africa, Asia, Europe and Japan, and North America, on the basis of the level of economic development and judicial expenses.
(2) According to the report, 882 suspects are accounted for in the cost of prosecutions and imprisonment, but the cost excludes 207 suspects (143 suspects held in Kenya and 64 suspects he ld in the Seychelles), which were covered by funding from UNODC Counter Piracy Programme. The report estimates the cost of prosecutions and imprisonment at $16,429,631 (refer to the following table).
Cost of Piracy Prosecutions
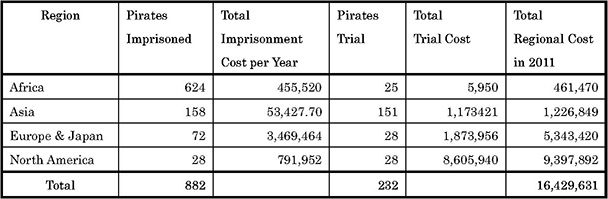
Source: The Economic Cost of Somali Piracy 2011, p.24, Table 5.
8. The Cost of Military Operations: $1,273,266,011
(1) In 2011, over 30 countries dispatched naval ships, patrol aircraft, and other military personnel, etc. The report estimates the cost of these military operations in two forms, the administrative budgets of the ‘big three’ missions in the region: the European Union Naval Force (EUNAVFOR) Operation Atalanta, NATO’s Operation Ocean Shield, and Combined Task Force (CTF) 151, and the operating costs of each contributing state. Nations contribute to one of the major missions through: Navy vessels (surface combat vessels and auxiliary ships), Maritime patrol/reconnaissance aircraft, Vessel Protection Detachment teams, Military staff assigned to Operational Headquarters or onboard units.
(2) The report estimates the operating cost of three multinational anti-piracy task forces at $219 million. The detail of the cost is as follows.
(a) EUNAVFOR: $10.9 million
EUNAVFOR is typically composed of 5-10 frigates or destroyers, one auxiliary, and three maritime patrol or reconnaissance aircrafts. The contributing nations of EUNAVFOR are Belgium, Estonia, France Germany, Greece, Italy, Luxembourg, The Netherlands, Norway, Portugal, Spain, Sweden, and the United Kingdom.
According to EUNAVFOR’s home page, as of March 2012, EUNAVFOR is composed of a French supply vessel (flag ship), two French frigates, a French aircraft, a German supply vessel, a German aircraft, an Italian frigate, a Luxembourg aircraft, a Dutch frigate, a Portugal frigate, a Spanish Corvette, a Spanish frigate, and a Spanish aircraft.
(b) NATO’s Operation Ocean Shield: $5.5 million
The contributing nations of NATO’s Operation Ocean Shield are composed of Denmark, Norway, Turkey, the United States, etc.
(c) CTF-151: $5.5 million
CTF-151 is a multinational task force for use in in the Gulf of Aden, and off the coast of Somalia. CTF-151 is composed of detached units from Denmark, South Korea, Pakistan, Turkey, the United States, Australia, Bahrain, New Zealand, and Singapore.
(3) The report estimates the operating cost of warships and patrol aircraft form each country, including the fuel and operational costs based on an approximation of the number of vessels deployed on a daily basis. Using the figures above on the average number of vessels deployed for the three major operations, as well as independent deployers, the report estimates as shown below that on any given day, the vessels deployed might be double the typical composition of the EUNAVFOR forces. Accordingly, the annual operating cost is estimated at $959,909,773. (See Table 3)
(4) The report also estimated the cost of unmanned aerial vehicles (UAVs) working on counter-piracy efforts in the Indian Ocean. The major suppliers of UAVs for counter-piracy missions are the US, India and Spain. U.S. deploys 4 Reaper, and Spain deploys 4 Scan Eagle. Since India deploys 100 Searcher?and Heron for various national security activities in the region, the report estimated that only a third of those UAVs were used towards counter-piracy activities. According to the report, the operational cost of UAVs in counter-piracy activities is estimated at $291,456,238.
9. The Cost of Counter-piracy organizations: $21.3 million
In 2011, over 11 organizations conducted anti-piracy efforts. The major organizations were: Trust Fund to Support Initiatives of States to Counter Piracy off the Coast of Somalia (‘Trust Fund’), The United Nations Office of Drugs and Crime (UNODC), The Contact Group on Piracy Off the Coast of Somalia (CGPCS), The Djibouti Code of Conduct、 The United Nations Development Program − Somalia, UN Political Office for Somalia (UNPOS), etc. The report estimates the total cost of contributions from each country and operational budgets for these organizations at $21.3 million.
Table 1: Ransoms paid in 2011
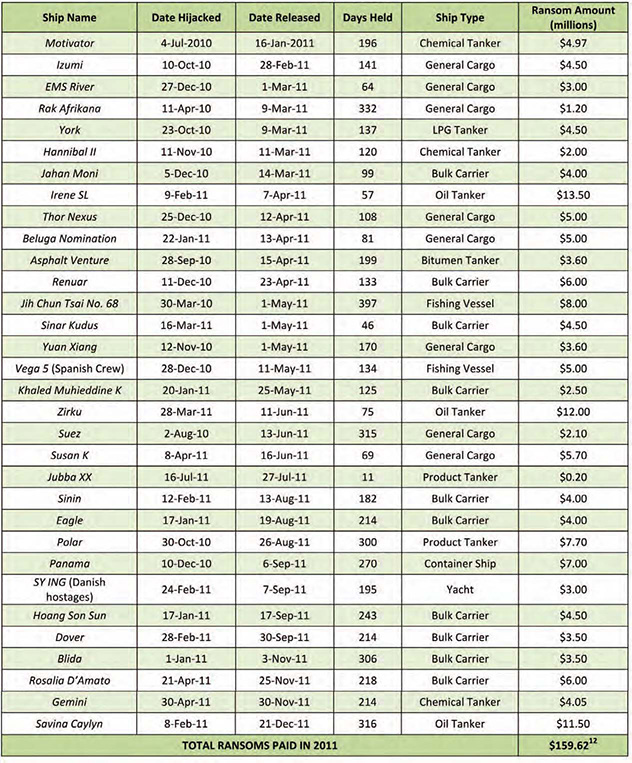
Source: The Economic Cost of Somali Piracy 2011, p.12, Table 1.
Table 2: Pirate Suspects & Trials
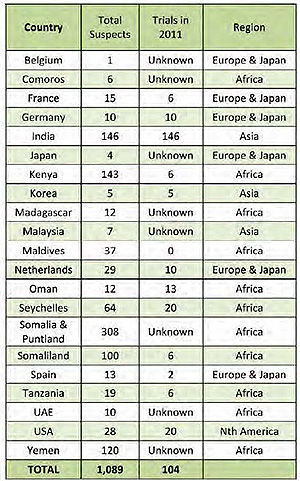
Source: The Economic Cost of Somali Piracy 2011, p.23, Table 4.
Note: On the early morning of March 5 2011, a U.S. Navy’s guided missile destroyer, the USS Bulkeley (DDG 84) assigned to multinational counter-piracy mission Combined Task Forces (CTF) 151, rescued a Japanese-related oil tanker, MV Guanabara (57,000 DWT), from pirate attack, and detained four suspected pirates. Afterwards, they were transferred to Japan. The four suspects in detention pending trial have been charged in court at the moment.
Table 3: Cost of Counter-Piracy Military Vessels
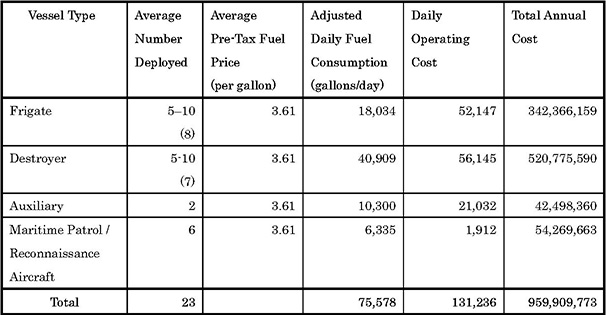
Source: The Economic Cost of Somali Piracy 2011, p.27, Table 7.
Note:
(a) Fuel Cost: $3.61 per gallon; calculated using the pre-tax average diesel price from January-October 2011 from Belgium, France, Germany, Italy, Netherlands, UK, and USA.
(b) Methodology for adjusted daily fuel consumption:
1. Calculation of daily fuel consumption:
i. Divide the listed range by the listed fuel capacity (in some cases converted from tons to liters) to calculate the ‘gas mileage’ for each craft.
ii. Divide the ‘gas mileage’ by the listed cruising speed to calculate ‘gallons burned per hour’.
iii. Multiply ‘gallons burned per hour’ by 24 to get daily fuel consumption.
2. Adjustment: as per discussions with a navy representative, ships are assumed to be operating 25 days per month; and aircraft fly 5 hours per day.
(c) Model ships used for classification: Frigate: Oliver Hazard Perry Class (U.S.); Destroyer: Arleigh Burke Class (U.S.); Auxiliary: average of Quinghaihu Supply Ship (China), INS Sukanya Patrol Ship (India), and Galicia Class Amphibious Ship (Spain); Aircraft: P-3C Orion (multiple countries).
From “Intelligence Analysis (March 2012)”
関連記事