
Contents *Unauthorized reproduction is prohibited
SPF China Observer
HOMENo.26 2020/04/10
The high mortality rate of COVID-19 and the collapse of the medical system in Wuhan as demonstrated by data
Takashi Sekiyama (Associate Professor, GSAIS, Kyoto University)
In the small span of less than six months since coronavirus disease (COVID-19) was confirmed in Wuhan, Hubei Province, China, in December 2019, the entire world has been exposed to its threat.
It is reported that there has been a total of 81,907 cases of COVID-19 in China as of April 9, 2020. Of these, 50,008 (61.1% of the total cases in China) occurred in Wuhan. The number of cases in Hubei Province other than those in Wuhan totaled 17,795 (21.7% of the national total). In addition, of 3,336 deaths in China due to COVID-19, 2,575 (77.2% of the total) occurred in Wuhan. The number of deaths in Hubei Province—excluding those in Wuhan—totaled 641 (19.2% of the total: Chinese National Health Commission, 2020).
Just by looking at these total figures, it is clear that the risk of mortality in Wuhan due to COVID-19 was extremely high. Calculations based on data publicized by the Chinese National Health Commission show that the mortality rate (the CFR, or case fatality rate: the number of deaths vs. the reported number of patients) in Wuhan was 5.1%. This was far above the national rate for all regions of China, except for Hubei Province, which was at 0.9%.
The question, then, is why the mortality rate in Wuhan was so much higher than in other Chinese cities. In this paper, I will examine this question through comparisons of the medical standards in Wuhan and other Chinese cities and data on the numbers of COVID-19 patients and numbers of deaths in Wuhan and other Chinese cities.
Hypothesis 1: The medical system was insufficiently prepared
One hypothesis that may explain why the mortality rate was so high in Wuhan is the possibility that medical care available in Wuhan may have been substandard. If the level of medical care in Wuhan was of a lower standard than the care available in other Chinese cities, it would stand to reason that the mortality rate in Wuhan would be high.
However, the medical standards in Wuhan are among the highest in China; thus, this hypothesis cannot stand.
To know what the medical standards were in Wuhan, it is necessary to understand the hospital ranking system in China. According to the Hospital Classification and Management Regulation, all hospitals in China (medical facilities with 20 or more beds are considered “hospitals”) are ranked as either Grade 1, Grade 2, or Grade 3 hospitals according to a unified national standard that uses factors such as the number of hospital beds, floor area, number of people on staff, technological level, and medical equipment on the premises. All these grades are further subdivided into A, B, or C. Since Grade 3 also contains the highest specialized grade, hospitals in China are classified by level of medical standard into three grades and a total of ten subdivisions (Table 1).
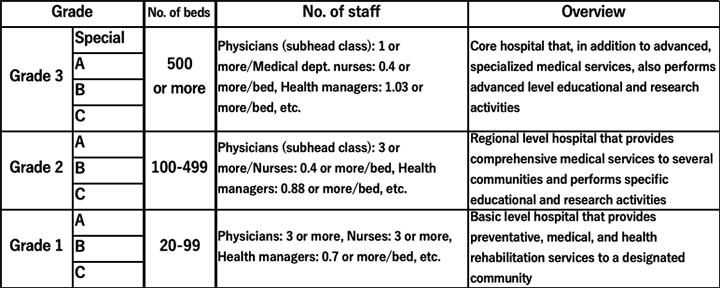
Source: Chart created by the author based on the “Hospital Classification and Management Regulation” and the “General Hospital Grading and Management Standards”
As of the end of 2018, there were 2,548 Grade 3 hospitals (general hospitals with at least 500 hospital beds that were able to provide advanced, specialized medical services) in China, of which those in 1,442 locations were of the higher Grade 3A level. There are Grade 3 hospitals at 130 locations in Hubei Province, and the hospitals at 70 of those locations are certified as Grade 3A hospitals (Chinese National Health Commission, 2019).
Wuhan is the capital of Hubei Province and its largest city, and as such it has the highest medical standards in the province. Sixty-one of the 130 Grade 3 hospitals in Hubei Province are in Wuhan, and 27 of these are Grade 3A (Wuhan Municipal Health Commission, 2019). This means that 46.9% (approximately half) of the Grade 3 hospitals in Hubei Province are concentrated in Wuhan, and that 38.6% of the Grade 3A hospitals in the province are located in Wuhan.
Thus, the level of medical care available in Wuhan is among the highest in the nation. An investigation of the number of Grade 3 hospitals (as of the end of 2018) by population shows that there are 5.51 Grade 3 hospitals and 2.44 Grade 3A hospitals per 1 million people in Wuhan (population: 11.08 million). When compared to the figures for the total population of China (1,395,380,000), one finds that they greatly exceed the 1.83 Grade 3 hospitals and 1.03 Grade 3A hospitals per 1 million of the Chinese population as a whole. Even if we compare the figures for the entirety of Hubei Province (population: 59,170,000), which show that there are 2.20 Grade 3 hospitals and 1.18 Grade 3A hospitals per 1 million of the population, it is clear that a large number of the core general hospitals in the Province are concentrated in Wuhan. When looking at the cities in China with the highest percentages of Grade 3A hospitals (as of the end of 2018), we see that Wuhan is in fifth place, following Beijing (55 locations), Guangzhou (38), Shanghai (32), and Tianjin (31).
Based on the fact that Wuhan has a high level of medical care available, whether compared to the rest of Hubei Province or to China as a whole, it is difficult to point to the level of medical care in Wuhan as the cause of the high mortality rate in that city as compared to other cities in China.
Hypothesis 2: Breakdown of the medical care system
Why, then, was the COVID-19 mortality rate so much higher in Wuhan than in other Chinese cities? The answer becomes clearer when comparing changes in the numbers of patients and the mortality rate in Wuhan and other cities.
Figures 1 and 2 show the total reported numbers of patients and deaths reported in Wuhan; in the rest of Hubei Province except for Wuhan; and in the rest of China except for Hubei Province. Figure 3 shows the changes in the total number of reported patients per 1 million of the population. The period during which such comparisons of these three regions are possible based on available data is January 22 to February 11.
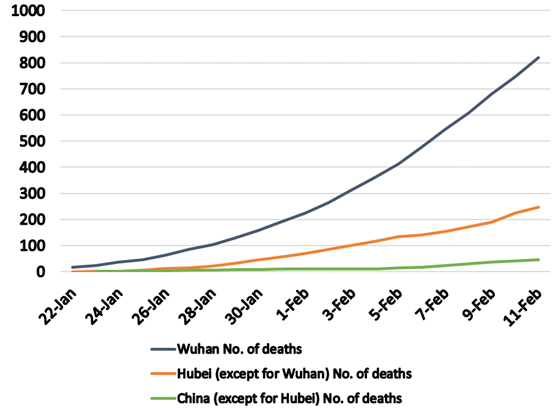
Source: Reprinted from Sekiyama (2020). Author created the graph based on data from the Chinese National Health Commission (2020) and the Wuhan Municipal Health Commission (2020).
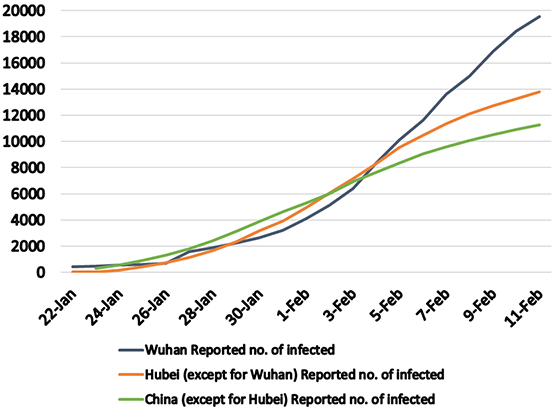
Source: Reprinted from Sekiyama (2020). Author created the graph based on data from the Chinese National Health Commission (2020) and the Wuhan Municipal Health Commission (2020).
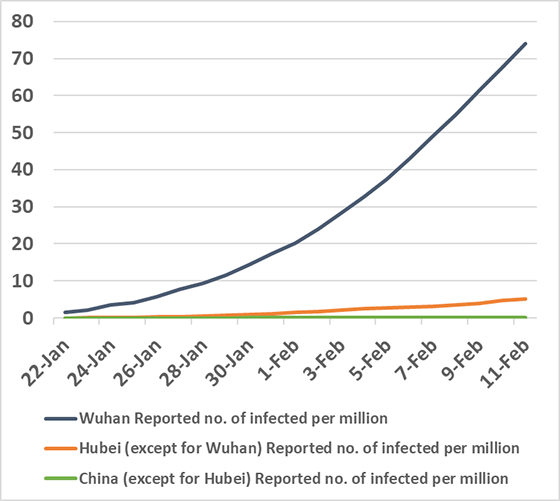
Source: Author created the graph based on data from the Chinese National Health Commission (2020) and the Wuhan Municipal Health Commission (2020).
A comparison of the changes in the total numbers of deaths in these three regions (Fig. 1) shows that the number of deaths in Wuhan increased precipitously. A comparison of the changes in the total number of those infected (Fig. 2) show that there were not particularly large differences among the figures for the three regions: Wuhan; Hubei Province, except for Wuhan; and China, except for Hubei Province.
Thus, we see that, in Wuhan, the rapid rise in the total number of deaths was associated with a rise in the total number of infected people, while in other cities in China, increases in the numbers of deaths attributed to COVID-19 did not match the rate of increase in the number of those infected.
Why then was there such a rapid increase in the total number of deaths in Wuhan? The key to identifying the cause is the breakdown of the medical system. Here, “breakdown of the medical system” is defined as an imbalance caused by a too-rapid increase in the demand for medical services, and the insufficiency of appropriate medical services for those who require medical care.
As is widely known, those who sought medical care in Wuhan were not restricted only to those who were infected with COVID-19. In fact, large numbers of people who were anxious about having possibly contracted the disease also flooded into hospitals. People formed long queues outside hospitals and waited until late into the night for the chance to be examined, and people who were unable to undergo an examination remained in the city in large numbers. This situation is the very definition of a breakdown of the medical care system. In other parts of Hubei Province and in other cities throughout China, such a breakdown of the medical system did not occur.
Thus, we are now faced with the issue of why this breakdown occurred only in Wuhan. As indicated above, the medical care available in Wuhan was, generally speaking, of a higher standard than in the rest of Hubei Province and in other cities in China. In addition, the capacity to provide medical services was certainly not small. Despite this, why did the kind of breakdown of the medical care system, which was published and broadcast by the media, occur only in Wuhan?
The answer to this question can be found by comparing the reported numbers of patients per 1 million of the population. Comparing only the changes in the actual figures for the total number of reported patients in Wuhan, in Hubei Province except for Wuhan, and in China except for Hubei Province, shows that there are no major differences between Figures 2 and 3. However, as shown in Figure 3, when we examine the figures per 1 million of the population, only Wuhan shows a steep increase in the total reported number of patients.
Specifically, only in Wuhan did the population ratio figures show a steep increase in COVID-19 patients, and as a result of all those patients and potentially infected people flooding into hospitals, even the high medical capacity to care for patients that existed in Wuhan was overwhelmed, resulting in an imbalance between demand and supply.
As a result of this breakdown in the medical care system, medical facilities in Wuhan collapsed because of the vast numbers of people seeking care.
Suggestions for Japan
As can be seen from the above, the sudden drastic increase in the number of infected people can lead to a breakdown in the medical care system, even in large urban areas where there are high medical standards and a high degree of capacity. This, in turn, can lead to high-risk patients being overlooked and an unnecessary increase in infections, which then leads to higher mortality rates.
Thus, we turn our attention to what can be done to prevent the high mortality rate seen in Wuhan from occurring in places like Tokyo and Osaka. The key is preventing widespread infection, which in turn would prevent a breakdown of the medical care system. To achieve this, it is essential that physical contact between people be reduced.
Therefore, on January 23, the Chinese authorities sealed off Wuhan, prohibited all air, rail, and overland travel into and out of the city, and stopped subways, buses, and all other forms of public transportation within the city. These measures were intended to prevent people infected with COVID-19 disease from leaving Wuhan while at the same time preventing people in Wuhan from having physical contact with one another.
The failure to close off the city in time due to the delayed initial response has been criticized. Wuhan mayor Zhou Xianwang made the following statement at a press conference held on January 26: “Due to the Spring Holiday [the New Year’s holiday in China] and the novel pneumonia outbreak, at present over 5 million people have left Wuhan.” It cannot be ruled out that this was one cause of the spread of the infection across the world.
However, as can be seen from the three figures discussed above, despite the fact that the lockdown of the city of Wuhan was delayed, it is also true that this action prevented the breakdown of the medical care system in other regions of China, and it mitigated increases in the numbers of deaths in other regions of China. In addition, Wuhan itself—where internal movements were restricted—was successful in mitigating increases in the number of newly infected people.
A state of emergency was declared in Japan on April 7 to prevent a vast outbreak of infection and the breakdown of the medical care system. At the start of a press conference held that same night, Prime Minister Abe Shinzo thanked healthcare professionals and stated, “We will do everything necessary to protect locations where medical care is being provided.” Thus, he clearly indicated that the purpose of the emergency declaration was to prevent a breakdown of the medical care system.
The prime minister has been criticized for taking this action too late. However, if even in China, where people have pointed out the failures that resulted from these same kinds of delays in initial action, the lockdown of cities and the expansion of the medical care system facilitated the prevention of breakdowns in the medical system and mitigated increases in the number of deaths, then this is encouraging news for Japan.
If actual human contact can be reduced in Japan by 70% or 80%, then increases in the numbers of deaths in Tokyo and Osaka due to a breakdown in the medical care system in those cities and more widespread infections in other domestic population centers can be avoided, which will prevent the circumstances that existed in Wuhan from occurring in Japan. The success of such measures, however, depends upon each person’s actions.
(Dated Apr 9, 2020)
[References]
- Sekiyama, Takashi. (2020). “Lessons to be learned from the novel coronavirus mortality rate in Wuhan, which was five times those of other Chinese cities.” Ronza, Asahi Shimbun, April, 9, 2020.
- National Health Commission of the PRC. (2019). Annual Chinese Health Statistics, 2019.
- -----. (2020). Latest data on the novel coronavirus pneumonia.
- Wuhan Municipal Health Commission. (2019). Report on the Health Industry in Wuhan, 2018.
- -----. (2020). Wuhan Municipal Health Commission: Report on the Status of the Novel Coronavirus Pneumonia.