Essays and Commentary
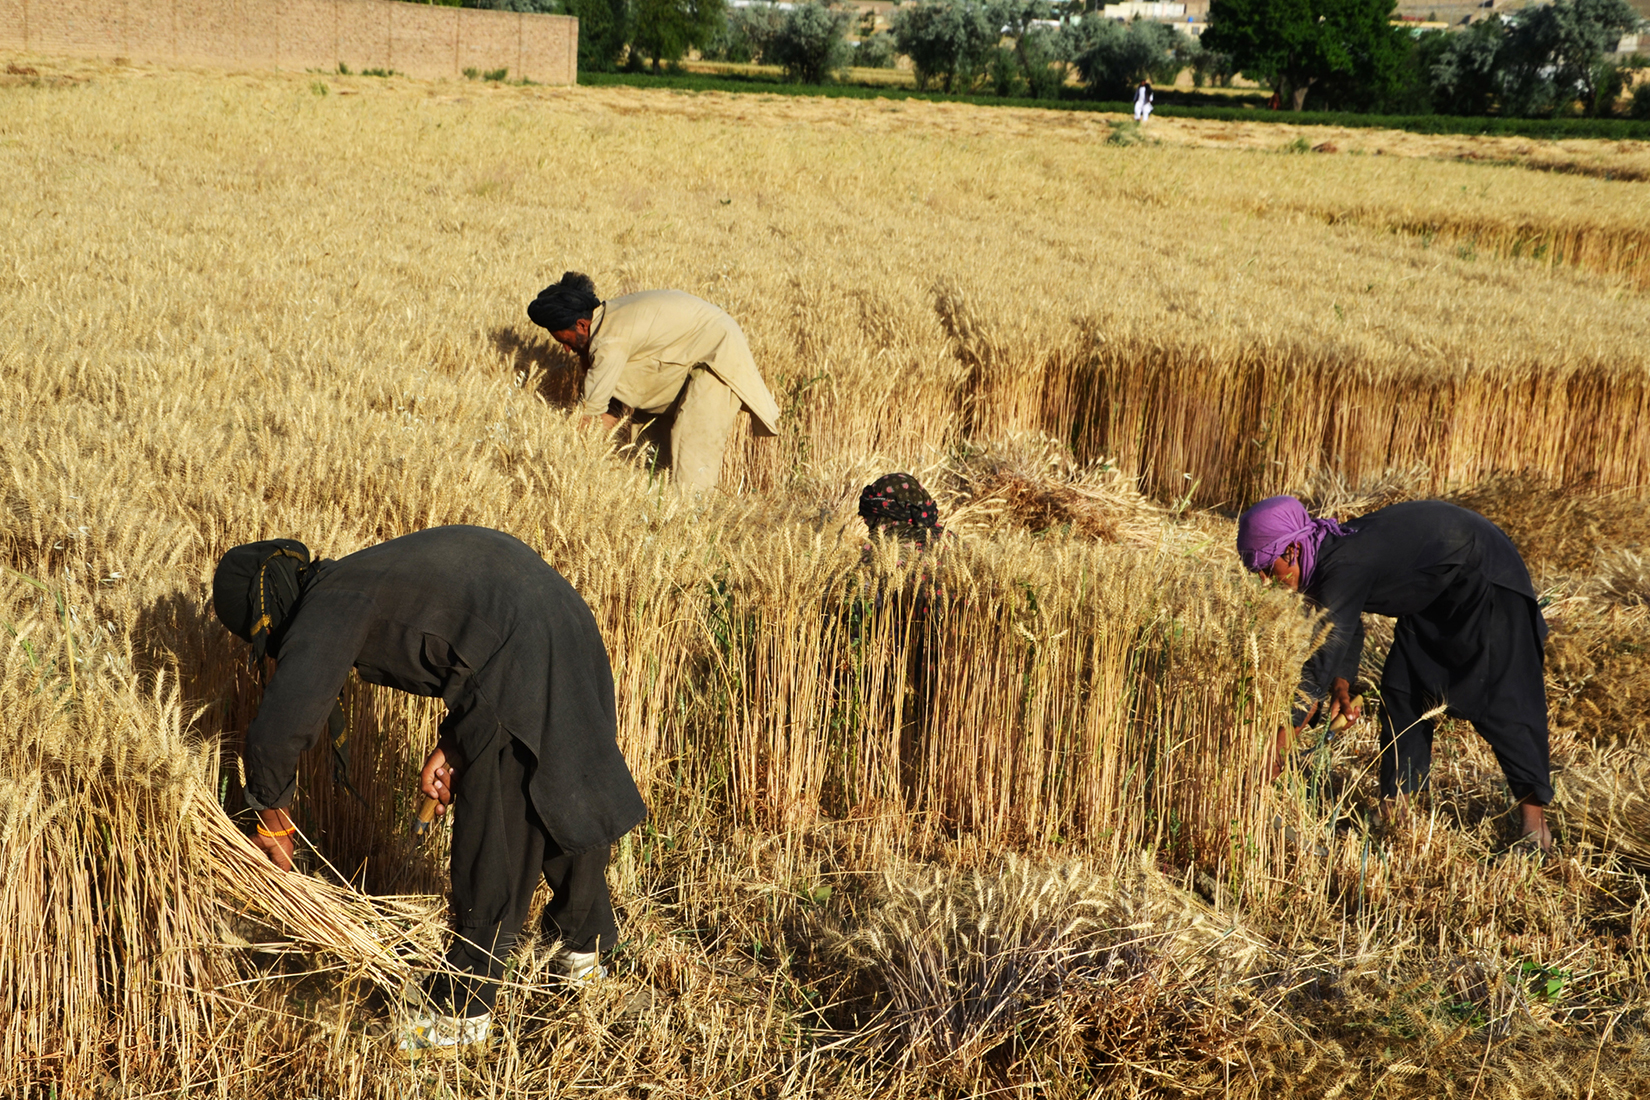
IINA: Japan’s Humanitarian Assistance for Increasing Food Production in Afghanistan ― Utilization of Private Sector Humanitarian Assistance in a Situation in Which Bilateral Assistance Is Difficult
The serious humanitarian crisis situation in Afghanistan is still going on currently, when two and a half years have passed since the second rule of Afghanistan by the Taliban regime started, and that regime is continuing to violate the human rights of women and girls and pressure the members of the media.
Read more